




GHG Emissions Inventories

GHG Emissions Inventories
ISO 14064 GHG Emissions Inventories and Intensity
100% cement plants in Taiwan & Mainland China, RMC plants, and Operation Headquarters obtained third-party ISO 14064-1 certification
100%
All Operational Sites (Weighted Average)
Taiwan
Mainland China
CIMPOR & OYAK Cement
2016 | 2021 | 2022 | 2023 | 2024 | 2025 | |
|---|---|---|---|---|---|---|
Cementitious Materials Production (million tons) | 47.69 | 42.29 | 34.6 | 31.82 | 53.41 | 54 |
GHG Emissions/ Cementitious Materials Production | 755 | 724 | 709 | 686 | 668 | 661 |
Note:
Coverage: 100% of production volume
The data in this table was inventoried according to the Ministry of Environment's inventory guidelines (ARS), and therefore, there is a slight discrepancy compared to the ISO 14064 database (AR6).
Internal Carbon Pricing & Carbon Trading Platform
Management Approaches
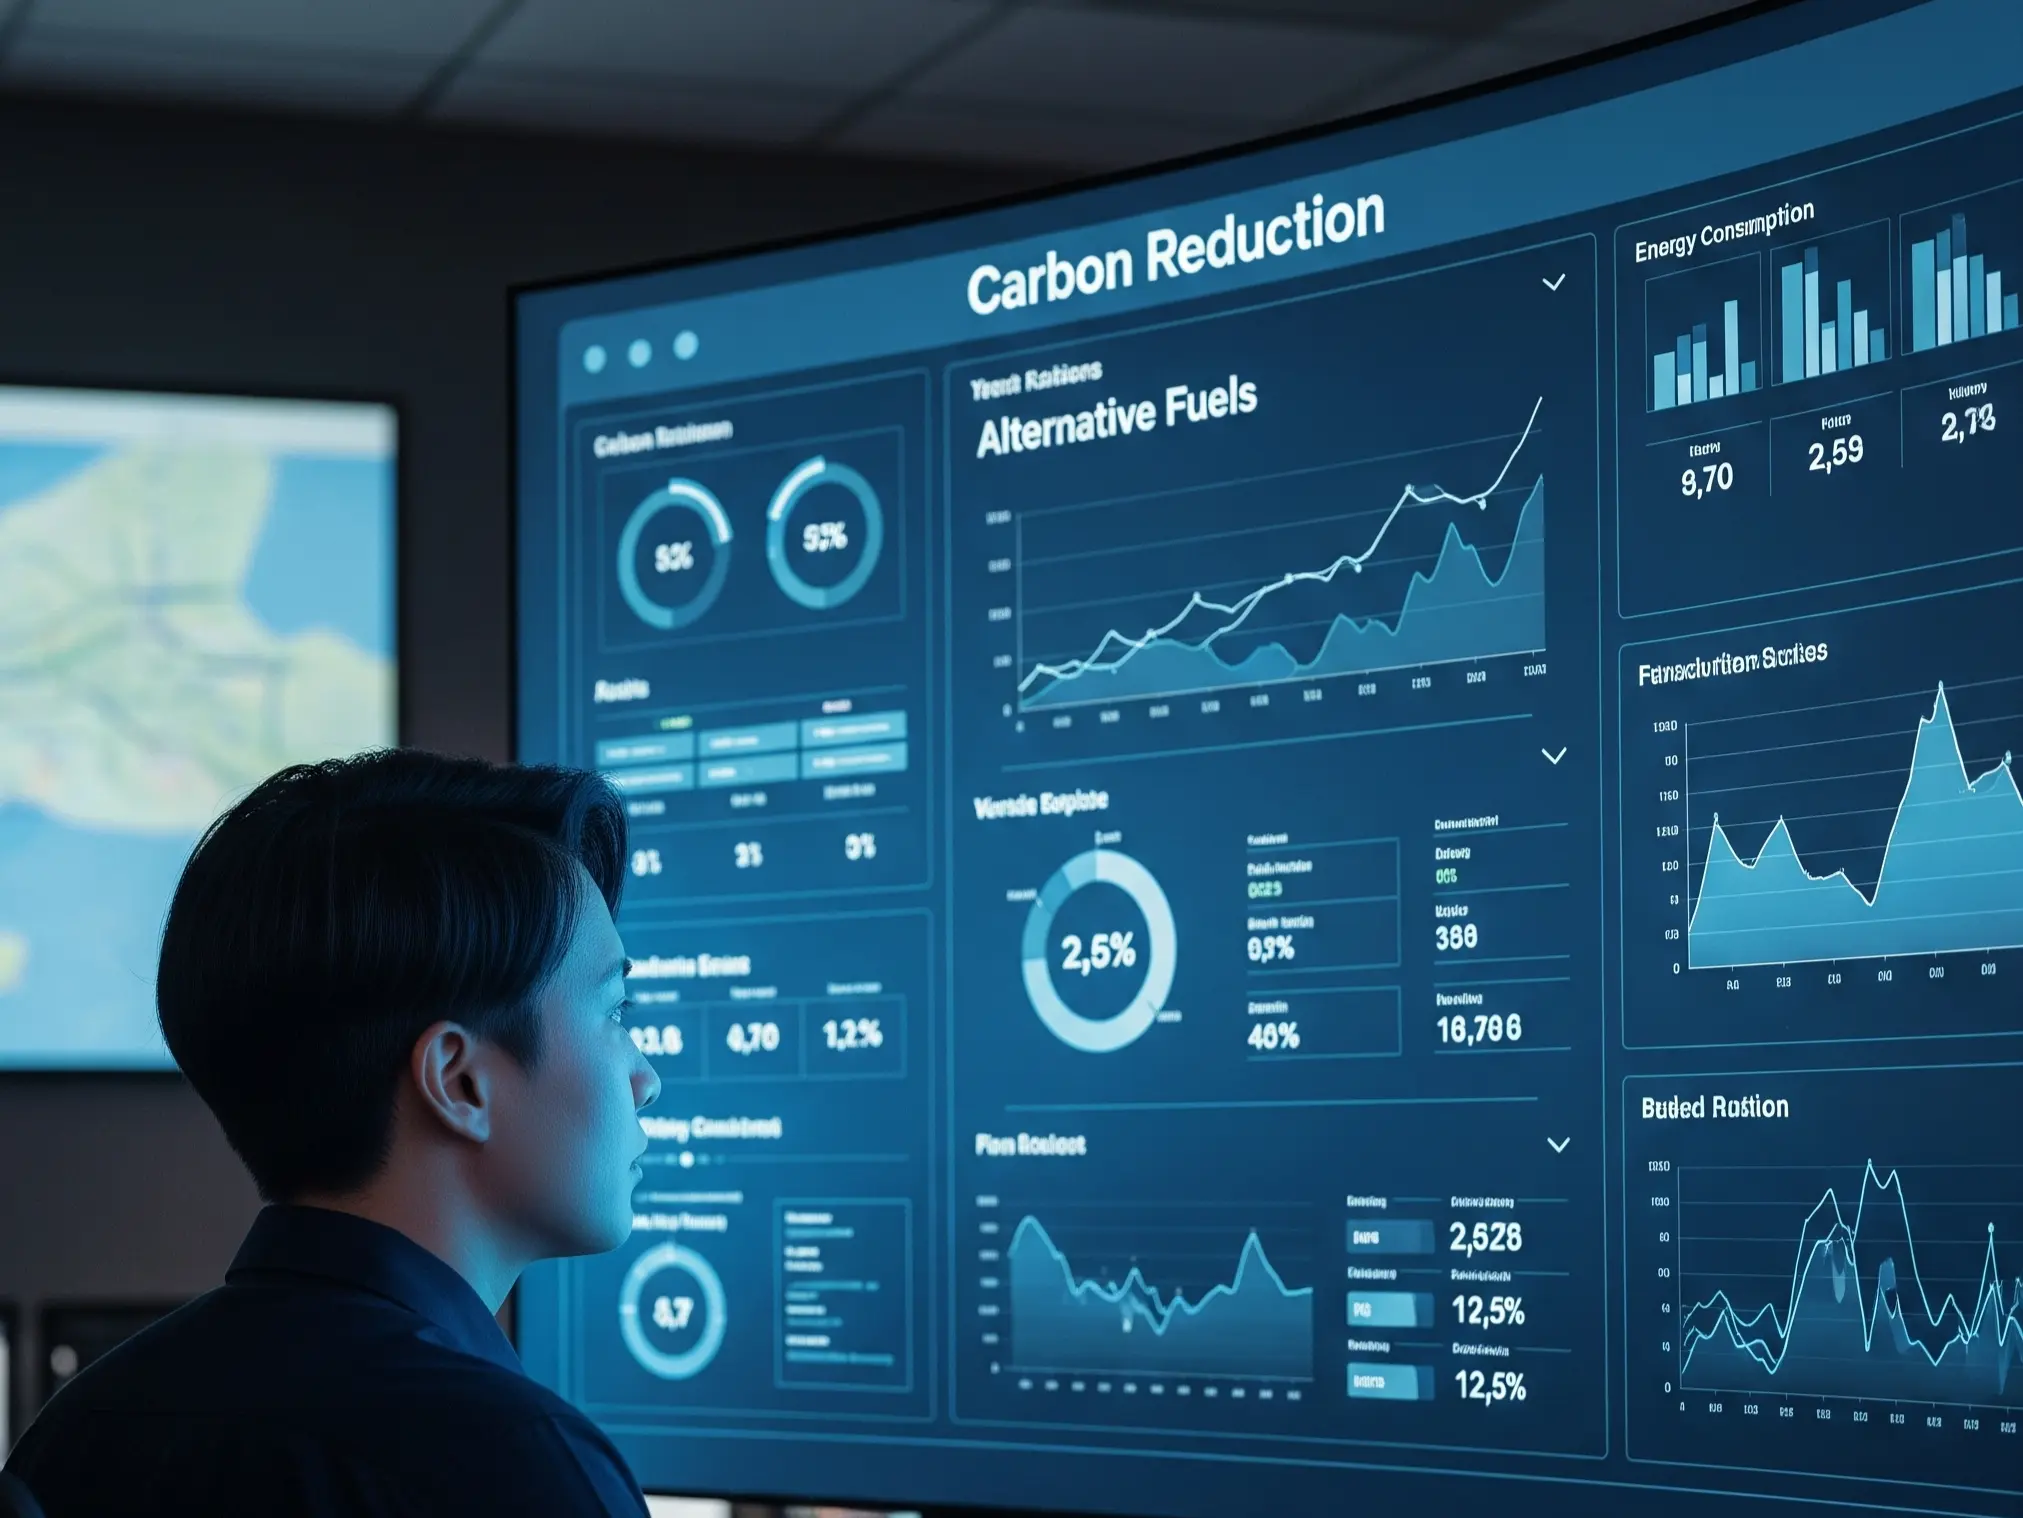
Daily: real-time data from the AI Carbon Reduction Management Platform, with alerts on progress against targets; Monthly: reporting to senior management meetings; Annually: linked to performance bonuses.
In 2021, TCC established the Assessment Method for Alternative Raw Material and Fuel Indicators in line with its SBT commitment. Each plant sets its own carbon reduction assessment indicators according to local conditions.
In response to the implementation of the EU Carbon Border Adjustment Mechanism (CBAM) and Taiwan's carbon fee, which takes effect in 2026, TCC introduced an internal carbon pricing (ICP) system within its Cement and Environmental Protection Business. Through cost-benefit analysis, the system reflects the potential impact of carbon costs on operations, investment, and financial performance in advance, and incorporates carbon costs and reduction benefits into capital expenditure evaluations, process improvements, and operational decisions.
Internal carbon trading platform: modeled on carbon trading markets, TCC launched an internal carbon trading platform in 2024 to allocate emission allowances and calculate reduction performance across cement plants in Taiwan and Mainland China. The results inform internal performance management and track carbon reduction actions, strengthening awareness of carbon costs and reduction incentives at each site.
In February 2026, TCC established the Global Carbon Trading Office to coordinate carbon asset management and trading strategy across the Group, improving the efficiency of global asset allocation and accelerating the Group's low-carbon transition.
| Taiwan | Mainland China | Europe | |
|---|---|---|---|
| Scope | Scope 1 and Scope 2 of 100% of the Cement and Environmental Protection Business (Asia), including cement plants, RMC plants, and grinding stations | Scope 1 of the cement plants of 100% of the Cement and Environmental Protection Business (Europe and Africa) | |
| Pricing Type | Shadow price | Implicit price | |
| Pricing Method | Based on the rate recommended at the 5th meeting of the Carbon Fee Review Committee in 2024, assuming the carbon fee is adjusted every two years | Referencing the carbon price trend indicated in the Stated Policies Scenario for Mainland China in World Energy Outlook 2024 | Based on forecasts from CEMBUREAU, the International Energy Agency (IEA), and Bloomberg New Energy Finance (BNEF) |
| Carbon Price | 2025–2026: NT$500 / tCO2e | 2025: RMB 105 / tCO2e 2026: RMB 154 / tCO2e | 2030: €150 / tCO2e (approx. US$175 / tCO2e) |
| Adjusted every two years, rising to NT$1,800 / tCO2e by 2030 | Rising to RMB 328 / tCO2e by 2040 | ||