- GHG Management
- Environment
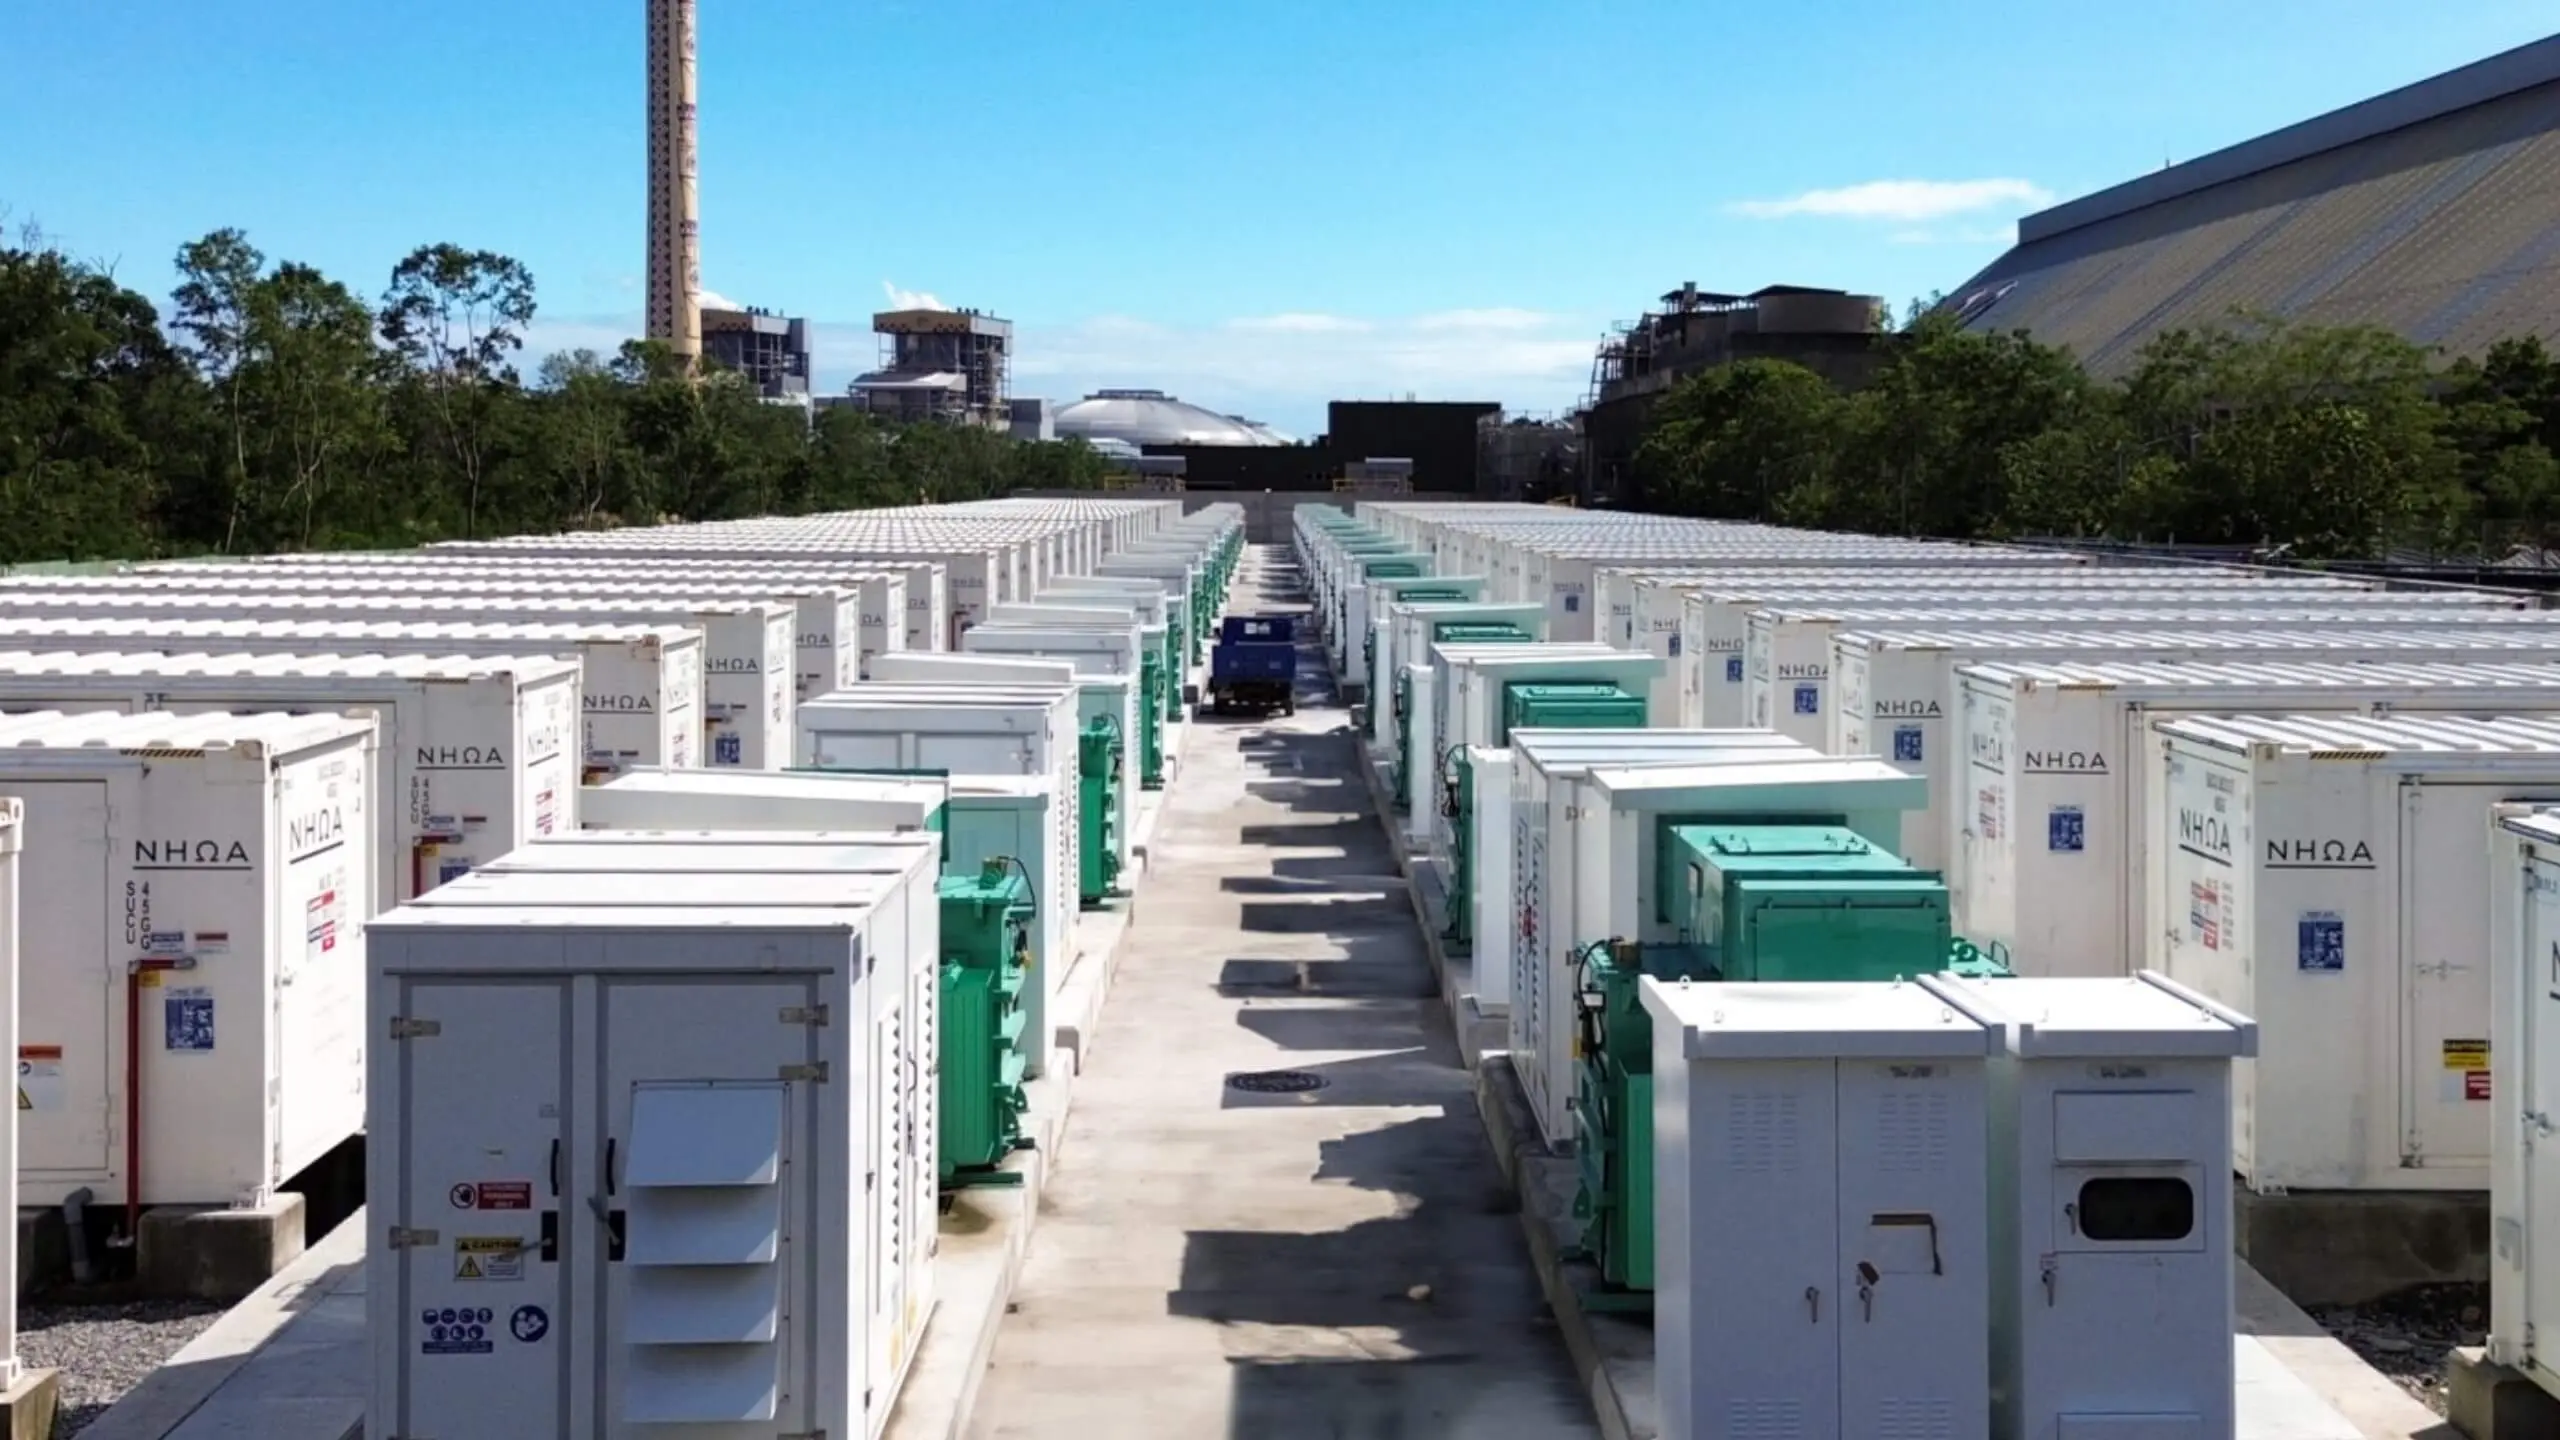
- Green Energy
- Society
- Employee
- Corporate Governance
- Indicators & Data
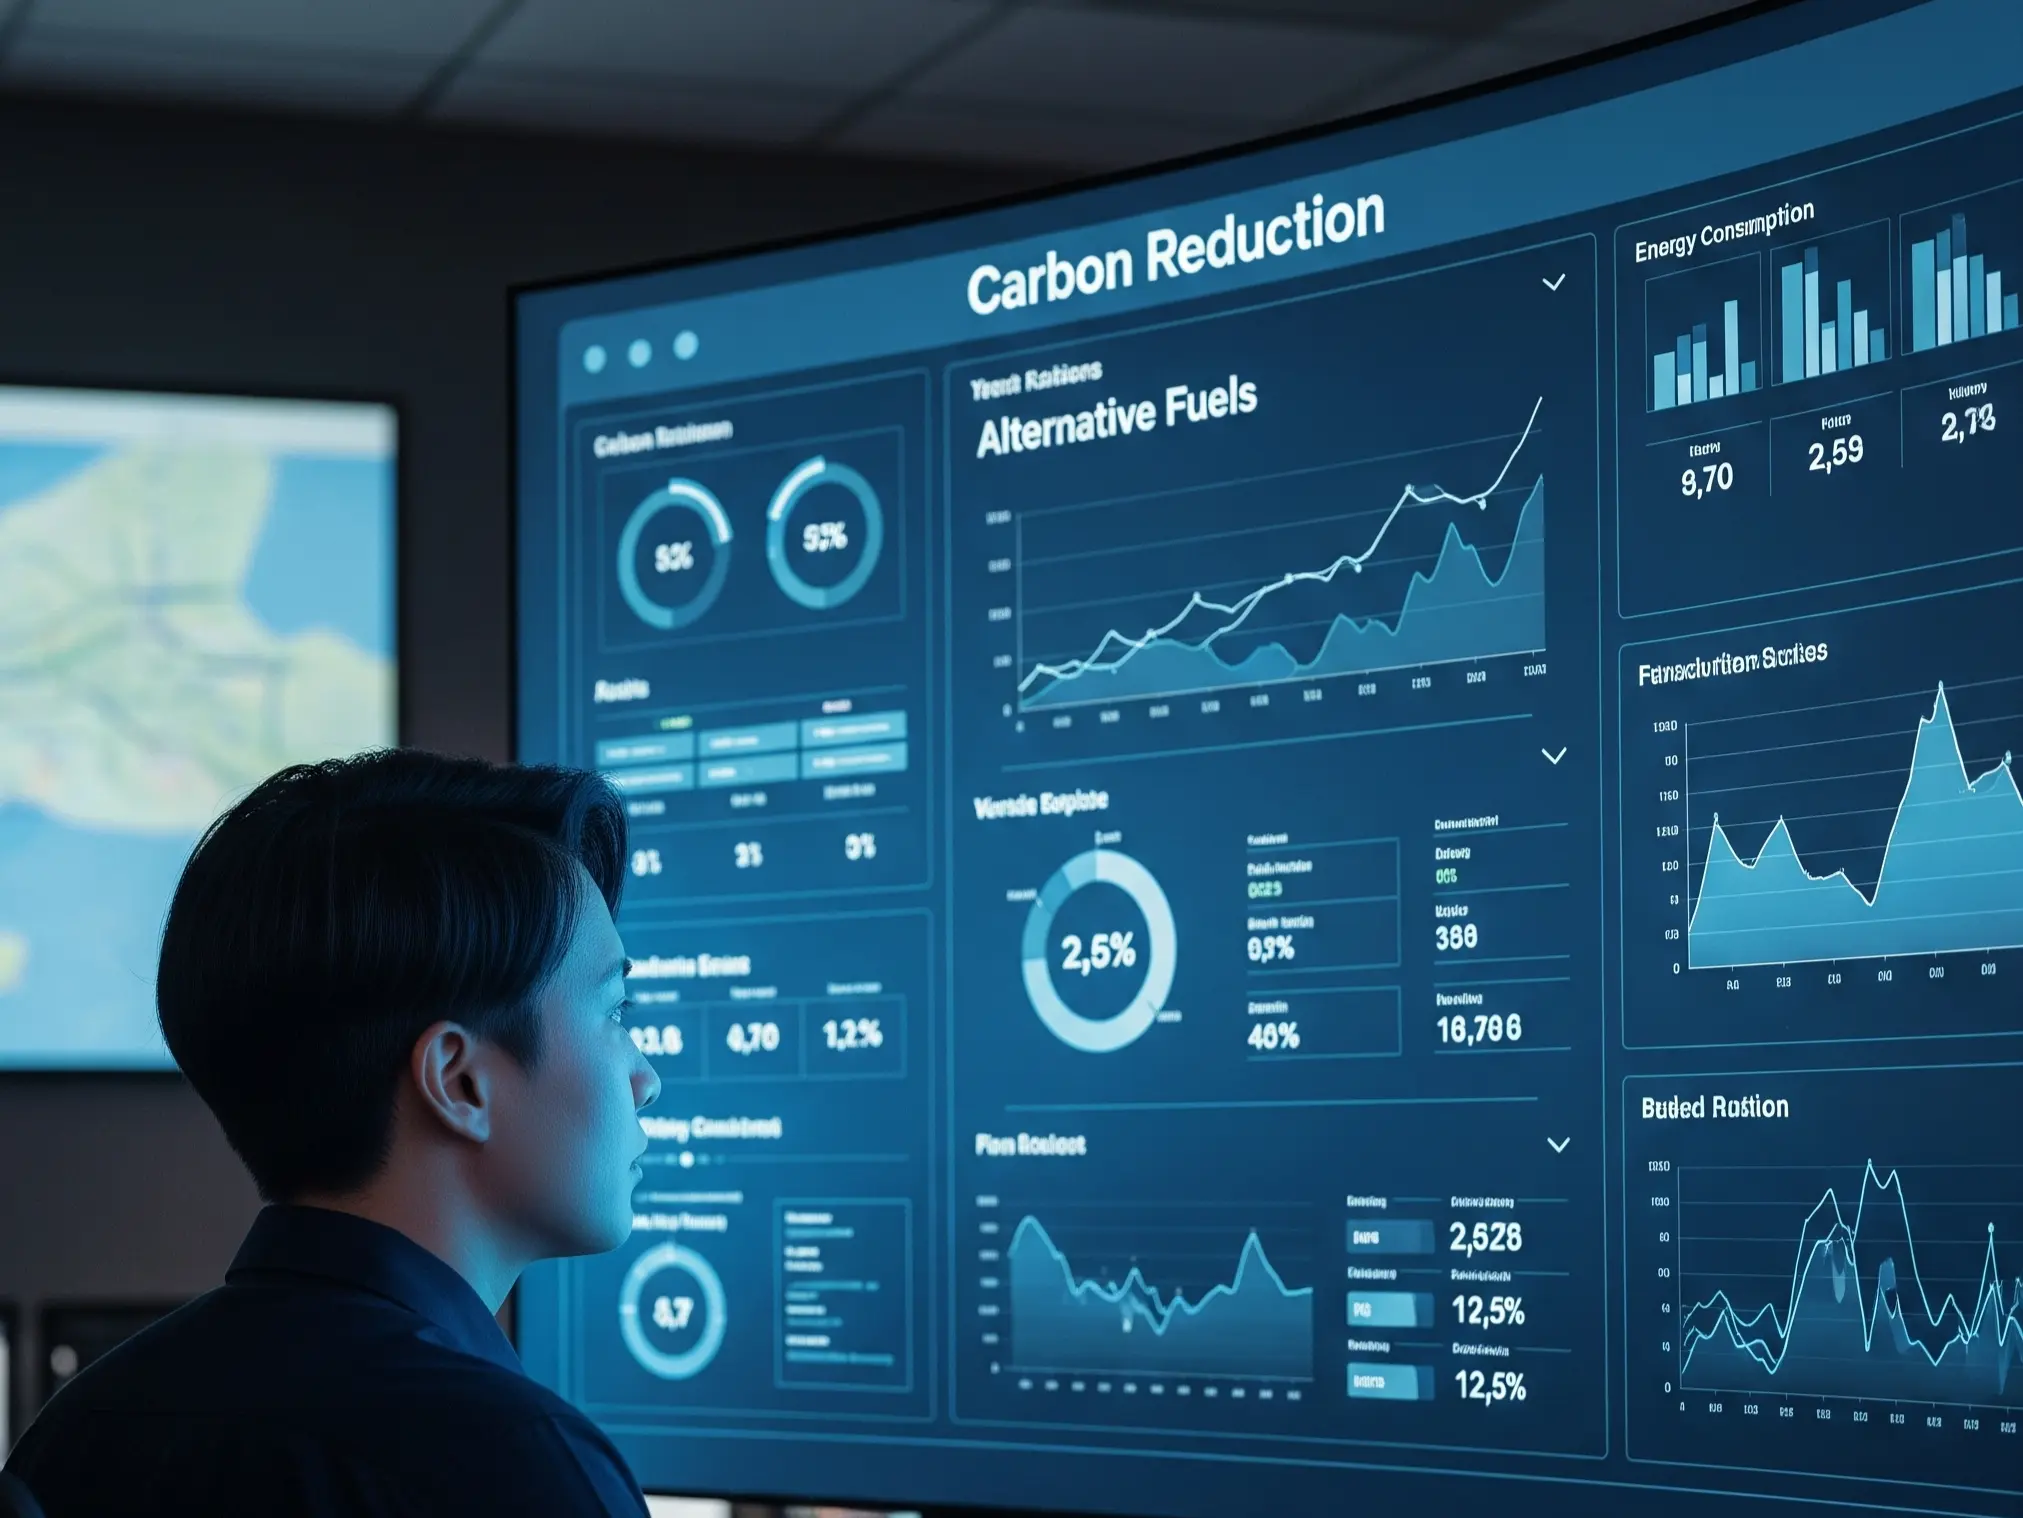
- Carbon Emissions (SBT)
- Scope 3 Management
- 2050 Net-zero Pathway for the Cement and Concrete Business Units Worldwide
- GHG Emissions Inventories
- Alternative Material and Fuel / Clinker
- Energy Efficiency
- Methane
- Environmental Management
- Air Pollution Control
- Waste Treatment / Material Efficiency
- Water
- Biodiversity
- Human Rights
- Employee Engagement
- Occupational Safety & Health
- Social Engagement
- Policy Influence
- Just Transition
- External Participation and Engagement
- Human Capital Management
- Human Capital Development
- Salary and Bonus
- Employee Engagement Survey
- Employee Welfare
-
Shareholders' Meeting
-
Functional Committees
- Management Team Remuneration Policy
-
Corporate Governance Operations
- Risk Management
- Ethical Management
- Information Security
- Intellectual Property Rights
- Important Internal Regulations


- Investors
- Stakeholder Engagement
- Sustainability Recognition
- Report Download
- Sustainable E-newsletter
-
-
-
-
-
-
- Shareholders' Meeting
- Functional Committees
- Management Team Remuneration Policy
- Corporate Governance Operations
- Risk Management
- Ethical Management
- Information Security
- Intellectual Property Rights
- Important Internal Regulations
-
Indicators & Data