GHG Management


Net Zero by 2050

“That is the path we must succeed for the 30 years to come, the path of the carbon revolution!” ~ Chairman, Nelson An-ping Chang

In 2024, TCC Group Holdings will adhere to the 1.5°C pathway in accordance with the COP26 Climate Summit resolutions, setting science-based targets (SBT) for 2030, and committing to achieving net zero by 2050.
SBTi

TCC Group Holdings Committed SBT Carbon Reduction Target
TCC GROUP HOLDINGS cement business units include Taiwan, Mainland China, OYAK and CIMPOR.

The first cement company in East Asia to pass the Science-Based Targets (SBT) for carbon reduction
In December 2019, TCC committed to reduce carbon emissions in accordance with the SBT method, and to set goals based on the SBT well-below 2°C pathway
In July 2020, the SBTi review is passed. Base year: 2016. A target was set for the year 2025 (compared to the base year of 2016) to reduce Scope 1 carbon emission intensity by 11% and Scope 2 by 32%. SBT Decision Letter Link
TCC Well-below 2°C
2016
Base Year
2017 2018 2019 2020 2021 2022 2023 2025
Target Year
2030
Target Year
2050
Target Year
Carbon Emission Intensity
(Metric Tons CO2e / Metric Ton of Cementitious Materials)
0.755 0.736 0.738 0.740 0.733 0.724 0.709 0.686 0.675
(-11%)
0.585
(-22%)
Carbon Neutral Concrete
(Self-declared)
Progress Achieved N/A Achievement Rate
101%
Achievement Rate
99.69%
Achievement Rate
98.27%
Achievement Rate
97.93%
Achievement Rate
97.94%
Achievement Rate
98.78%
Achievement Rate
101%

The First Cement Company in East Asia to Commit to Net-zero by 2050, While Also Updating its 1.5°C SBT Goal.
Scope: A total of 14 cement plants in Taiwan and Mainland China

 SBT 1.5°C 2030 NEAR TERM Target 
Date submitted: July 3rd, 2024
Date passed: Q4 2024 expected
TCC Group Holdings has committed SBT 1.5°C target
Base year: 2016. A target was set for the year 2030 (compared to the base year of 2016) to reduce
Scope 1 carbon emission intensity by 23.9%, Scope 2 carbon emission intensity by 64.4%
The combined reduction for Scope 1+2 by 26.8% (adjustments will be made according to the SBT validation results)

 2050 NET-ZERO Commitment 
Date submitted: July 2nd, 2024
Commitment passed: On July 24th, 2024, TCC has received the official notification from SBTi as shown below:
SBTi證明
Target Setting for NET-ZERO and Schedule
Stage 1: Calculating Scope 3 emissions, TCC has completed 15 Scope 3 carbon inventories in Taiwan, and plan to expand to the Mainland China plants by the end of 2024
Stage 2: Expected to pass the SBT expert panel by the end of March 2025


Setting Status of Subsidiaries of TCC Group Holdings
In March 2024, TCC announced the completion of the expansion of its investment in low-carbon cement in Europe, forming a joint venture with Turkey's OYAK and has also acquired 100% of the shares of Portugal's CIMPOR
In its merger and acquisition strategy, TCC places a high emphasis on carbon reduction issues to enhance its global layout's carbon competitiveness. The SBT goals for OYAK and CIMPOR are as follows:
OYAK Cement
NEAR TERM LONG TERM NET-ZERO
1.5°C 1.5°C 2050
CIMPOR
NEAR TERM NET-ZERO
COMMITTED COMMITTED


TCC 10 Decarbonization & Green Transition Strategies
TCC Decarbonization & Green Transition Strategy:Alternative raw materials, Alternative fuels, Alternative clinker*, Equipment & Process enhancements, Power genration by waste heat recovery, Renewable energy, Energy storage, Power cells, Carbon Capture, Carbon sink
* New materials
** TCC will evaluate the progress of strategies and technological developments both domestically and internationally to neutralize residual emissions and/or further mitigate emissions beyond its value chain using carbon credits. These credits may be purchased from external or internationally verified sources, or from captured carbon in alignment with government policies for carbon credits


Scope 3 Inventory | Taiwan

Management Approaches
While reducing carbon emissions in its own cement industry, TCC goes further to influence the value chain to promote carbon reduction, aiming to become a company that proposes climate solutions and has a significant impact on carbon reduction. This initiative is intended to drive and collectively achieve net-zero targets. In 2023, TCC initiated a Scope 3 inventory in Taiwan, and has obtained a third-party verification.
Item Cement Plant RMC Plant Operation Headquarters (including Low-carbon R&D Center)
Purchased Goods and Services 135,997.0404 94,281.9293 1,352.7027
Capital Goods 46,738.7781 261.5054 645.1093
Fuel- and Energy-Related Activities Not Included in Scope 1 or Scope 2 120,213.7865 1,884.3995 306.7983
Upstream Transportation and Distribution 83,014.8159 68,662.1969 1.0231
Waste Generated in Operations 20.6384 95.4969 19.9614
Business Travel 15.7637 95.7656 149.2656
Employee Commuting 555.2565 356.1993 96.9158
Upstream Leased Assets 17.7676 403.5988 4,413.9969
Downstream Transportation and Distribution 66,973.7580 15,861.6036 0.0000
Processing of Sold Products 27,736.7582 9,506.9559 0.0000
Use of Sold Products 0.0000 0.0000 0.0000
End-of-Life Treatment of Sold Products 69,448.3364 59,670.1330 0.0000
Downstream Leased Assets 268.1522 16,350.2538 670.0480
Franchises 0.0000 0.0000 0.0000
Investments 0.0000 0.0000 5,491,803.3121
Total 551,000.8516 267,430.0380 5,499,460.1332
Unit:tCO2e

2050 Net-zero Pathway for the Cement and Concrete Business Units Worldwide

TCC’s Road Map to 2050 Net-zero Pathway for the Cement and Concrete Business Units Worldwide


Coverage
TCC Headquarters (including Low-carbon R&D Center)
Cement Plants in Taiwan, Mainland China, Turkey, and Portugal
RMC Plants in Taiwan, Turkey, and Portugal

Methodology
SBTi’s Sectoral Decarbonisation Approach (SDA) for the cement sector’s 1.5°C-aligned and net-zero SBT
ISO Net Zero Guidelines (IWA 42); ISO 14064-1
MIT En-ROADS net-zero simulator’s open-source formulas
International Energy Agency (IEA) Global Energy and Climate Model (GEC Model) logic and NZE Scenario parameters

Carbon reduction percentage. 1.Alternative clinker、Alternative raw materials 42%。2.Alternative fuels、Equipment & Process enhancements 35%。3.Equipment & Process enhancements、 Power genration by waste heat recovery 5%。4.Carbon Capture 18%
TCC Group Holdings Global Cement & Concrete Business Net-zero Pathway Implementation Steps

The Net-zero Pathway scope covers TCC Group Holdings Global Cement Business, including cement and RMC plants across Taiwan, Mainland China, Turkey, Portugal, Low-carbon R&D Centers, and TCC Headquarters in Taiwan. Upon reviewing the Net-zero Pathway for the TCC Group Holdings Global Cement & Concrete Business Units, it is feasible to achieve the SBTi Interim 1.5°C target in the context of existing regulations, permissions for alternative raw materials and fuels, and market demand. The carbon reduction measures for alternative clinker and raw materials are estimated to reduce emissions by approximately 19.56 million tons by 2050, contributing about 42% to the Net-zero Pathway; alternative fuels and process improvements are estimated to reduce emissions by approximately 16.08 million tons by 2050, contributing about 35%; renewable energy and power generation by waste heat are estimated to reduce emissions by approximately 2.29 million tons by 2050, contributing about 5%. TCC prioritizes the measures above to reduce carbon emissions, with CCUS as a last resort for reducing CO2 emissions. Considering the sustainability report targets, the IEA’s Net-zero Roadmap, and the simulation results of the above-mentioned carbon reduction measures, the CCUS targets for each year are set accordingly. Annual CO2 capture capacity for the group by 2050 will be 8.13 million tons, contributing about 18% to the Net-zero Pathway. Compared to the GCCA’s estimate of 36%, the IEA’s 48%, TCC’s Net-zero Pathway CCUS proportion of 18% is more realistic. A residual CO2e volume of 730,000 tons that needs to be counterbalanced can be handled following the ISO IWA 42 Net-zero Guidelines “Counterbalancing Residual Emissions.”
Avoided Emissions of TCC Business Units Worldwide
Using global standards and international methodologies, the external carbon reduction capabilities of low-carbon construction materials, renewable energy, energy storage, and the battery industry are assessed, aiming to transform and enhance corporate value through increased influence

Methodology
WBCSD’s Guidance on Avoided Emissions
WRI’s methodology for product carbon reduction impact quantification
European Union Innovation Fund’s Methodology for GHG Emission Avoidance Calculation

TCC Products & Services
Estimated proportion of external carbon reduction impact by 2030
Estimated proportion of external carbon reduction impact of TCC Products & Services by 2030:Cement Business Units and Low-carbon Construction Materials:Energy Business Units=63%:37%

2023 Performance 2030 Target
Low-carbon Construction Materials
Assist construction industry
-1.09 million tons
-1.69 million tons
Renewable energy
Assist energy sector
-60,000 tons
-530,000 tons
Energy Storage
Stabilize grid
-75,000 tons
-160,000 tons
Battery
Assist power tool customers
-2,300 tons
Assist the aviation industry
-320,000 tons
UNIT:CO2e

ISO 14064 GHG Emissions Inventories and Intensity

100% cement plants in Taiwan & Mainland China, RMC plants, and Operation Headquarters obtained third-party ISO 14064-1 certification
ISO 14064
Taiwan & Mainland China (weighted average)
Carbon emission intensity-cement in Taiwan & Mainland China (weighted average) in 2022 is 0.707 tCO2e/metric tons of cementitious materials. Carbon emission intensity-cement in Taiwan & Mainland China (weighted average) in 2023 is 0.690 tCO2e/metric tons of cementitious materials. Carbon emission intensity-cement in Taiwan & Mainland China (weighted average) has a 8.1% decrease in 2023 compared to 2022

2016 2019 2020 2021 2022 2023
GHG emissions (kt) 35,991.99 35,501.22 35,240.24 30,618.37 26,084.54 21,530.14
Cementitious materials production (Mt) 47.69 47.99 48.07 42.29 34.60 31.82
GHG emissions per Cementitious materials production (kg/t cementitious materials) 755 740 733 724 709 686
Coverage: 100% of production
Note: The data in this table is based on the Environmental Protection Administration's inventory guidelines (AR5), and therefore may slightly differ from the ISO 14064 database (AR6)

MAINLAND CHINA
Carbon emission intensity-cement in Mainland China in 2019 is 0.728 tCO2e/metric tons of cementitious materials. Carbon emission intensity-cement in Mainland China in 2020 is 0.723 tCO2e/metric tons of cementitious materials. Carbon emission intensity-cement in Mainland China in 2021 is 0.709 tCO2e/metric tons of cementitious materials. Carbon emission intensity-cement in Mainland China in 2022 is 0.690 tCO2e/metric tons of cementitious materials. Carbon emission intensity-cement in Mainland China in 2023 is 0.677 tCO2e/metric tons of cementitious materials
Carbon emission intensity-cement clinker in Mainland China in 2019 is 0.871 tCO2e/metric ton of clinker. Carbon emission intensity-cement clinker in Mainland China in 2020 is 0.859 tCO2e/metric ton of clinker. Carbon emission intensity-cement clinker in Mainland China in 2021 is 0.852 tCO2e/metric ton of clinker. Carbon emission intensity-cement clinker in Mainland China in 2022 is 0.841 tCO2e/metric ton of clinker. Carbon emission intensity-cement clinker in Mainland China in 2023 is 0.838 tCO2e/metric ton of clinker

TAIWAN
Carbon emission intensity-cement in Taiwan in 2019 is 0.814 tCO2e/metric tons of cementitious materials. Carbon emission intensity-cement in Taiwan in 2020 is 0.813 tCO2e/metric tons of cementitious materials. Carbon emission intensity-cement in Taiwan in 2021 is 0.806 tCO2e/metric tons of cementitious materials. Carbon emission intensity-cement in Taiwan in 2022 is 0.803 tCO2e/metric tons of cementitious materials. Carbon emission intensity-cement in Taiwan in 2023 is 0.769 tCO2e/metric tons of cementitious materials
Carbon emission intensity-cement clinker in Taiwan in 2019 is 0.857 tCO2e/metric ton of clinker. Carbon emission intensity-cement clinker in Taiwan in 2020 is 0.857 tCO2e/metric ton of clinker. Carbon emission intensity-cement clinker in Taiwan in 2021 is 0.855 tCO2e/metric ton of clinker. Carbon emission intensity-cement clinker in Taiwan in 2022 is 0.857 tCO2e/metric ton of clinker. Carbon emission intensity-cement clinker in Taiwan in 2023 is 0.828 tCO2e/metric ton of clinker
Carbon emission intensity-concrete in Taiwan in 2021 is 271.05 kg CO2e/m3. Carbon emission intensity-concrete in Taiwan in 2022 is 275.53 kg CO2e/m3. Carbon emission intensity-concrete in Taiwan in 2023 is 247.93 kg CO2e/m3


TAIWAN + MAINLAND CHINA
GHG Emissions |Unit: metric ton of CO2e
Item 2016 (Base year)* 2020 2021 2022 2023
Cement Plant
Scope 1 + 2 Taiwan 4,621,312 4,613,399 5,009,703 4,522,663 3,644,049
Mainland China 31,370,681 30,626,843 25,608,665 20,008,788 18,176,986
Total 35,991,993 35,240,241 30,618,367 24,531,451 21,821,036
Scope 3 Taiwan - 22,427 28,761 16,709 498,569
Mainland China - - - - 1,103,290
Total - 22,427 28,761 16,709 1,601,859
RMC Plant
Scope 1 + 2 Taiwan - 9,160 8,383 8,347 7,798
Scope 3 - - - 181,053 265,297
Distribution Station
Scope 1 + 2 Taiwan & Mainland China - - - - 1,455
Operation Office
Scope 1 + 2 Taiwan - 1,339 1,251 1,782 1,684
Mainland China - - - - 130
Total - - 1,339 1,251 1,814
Scope 3 Taiwan - - - 719 5,517,091
*SBT (WB2D) base year 2016 emissions: Scope 1 4,371,170 t CO2e; Scope 2 250,142 t CO2e


Internal Carbon Pricing & Carbon Trading Platform

Management Approaches
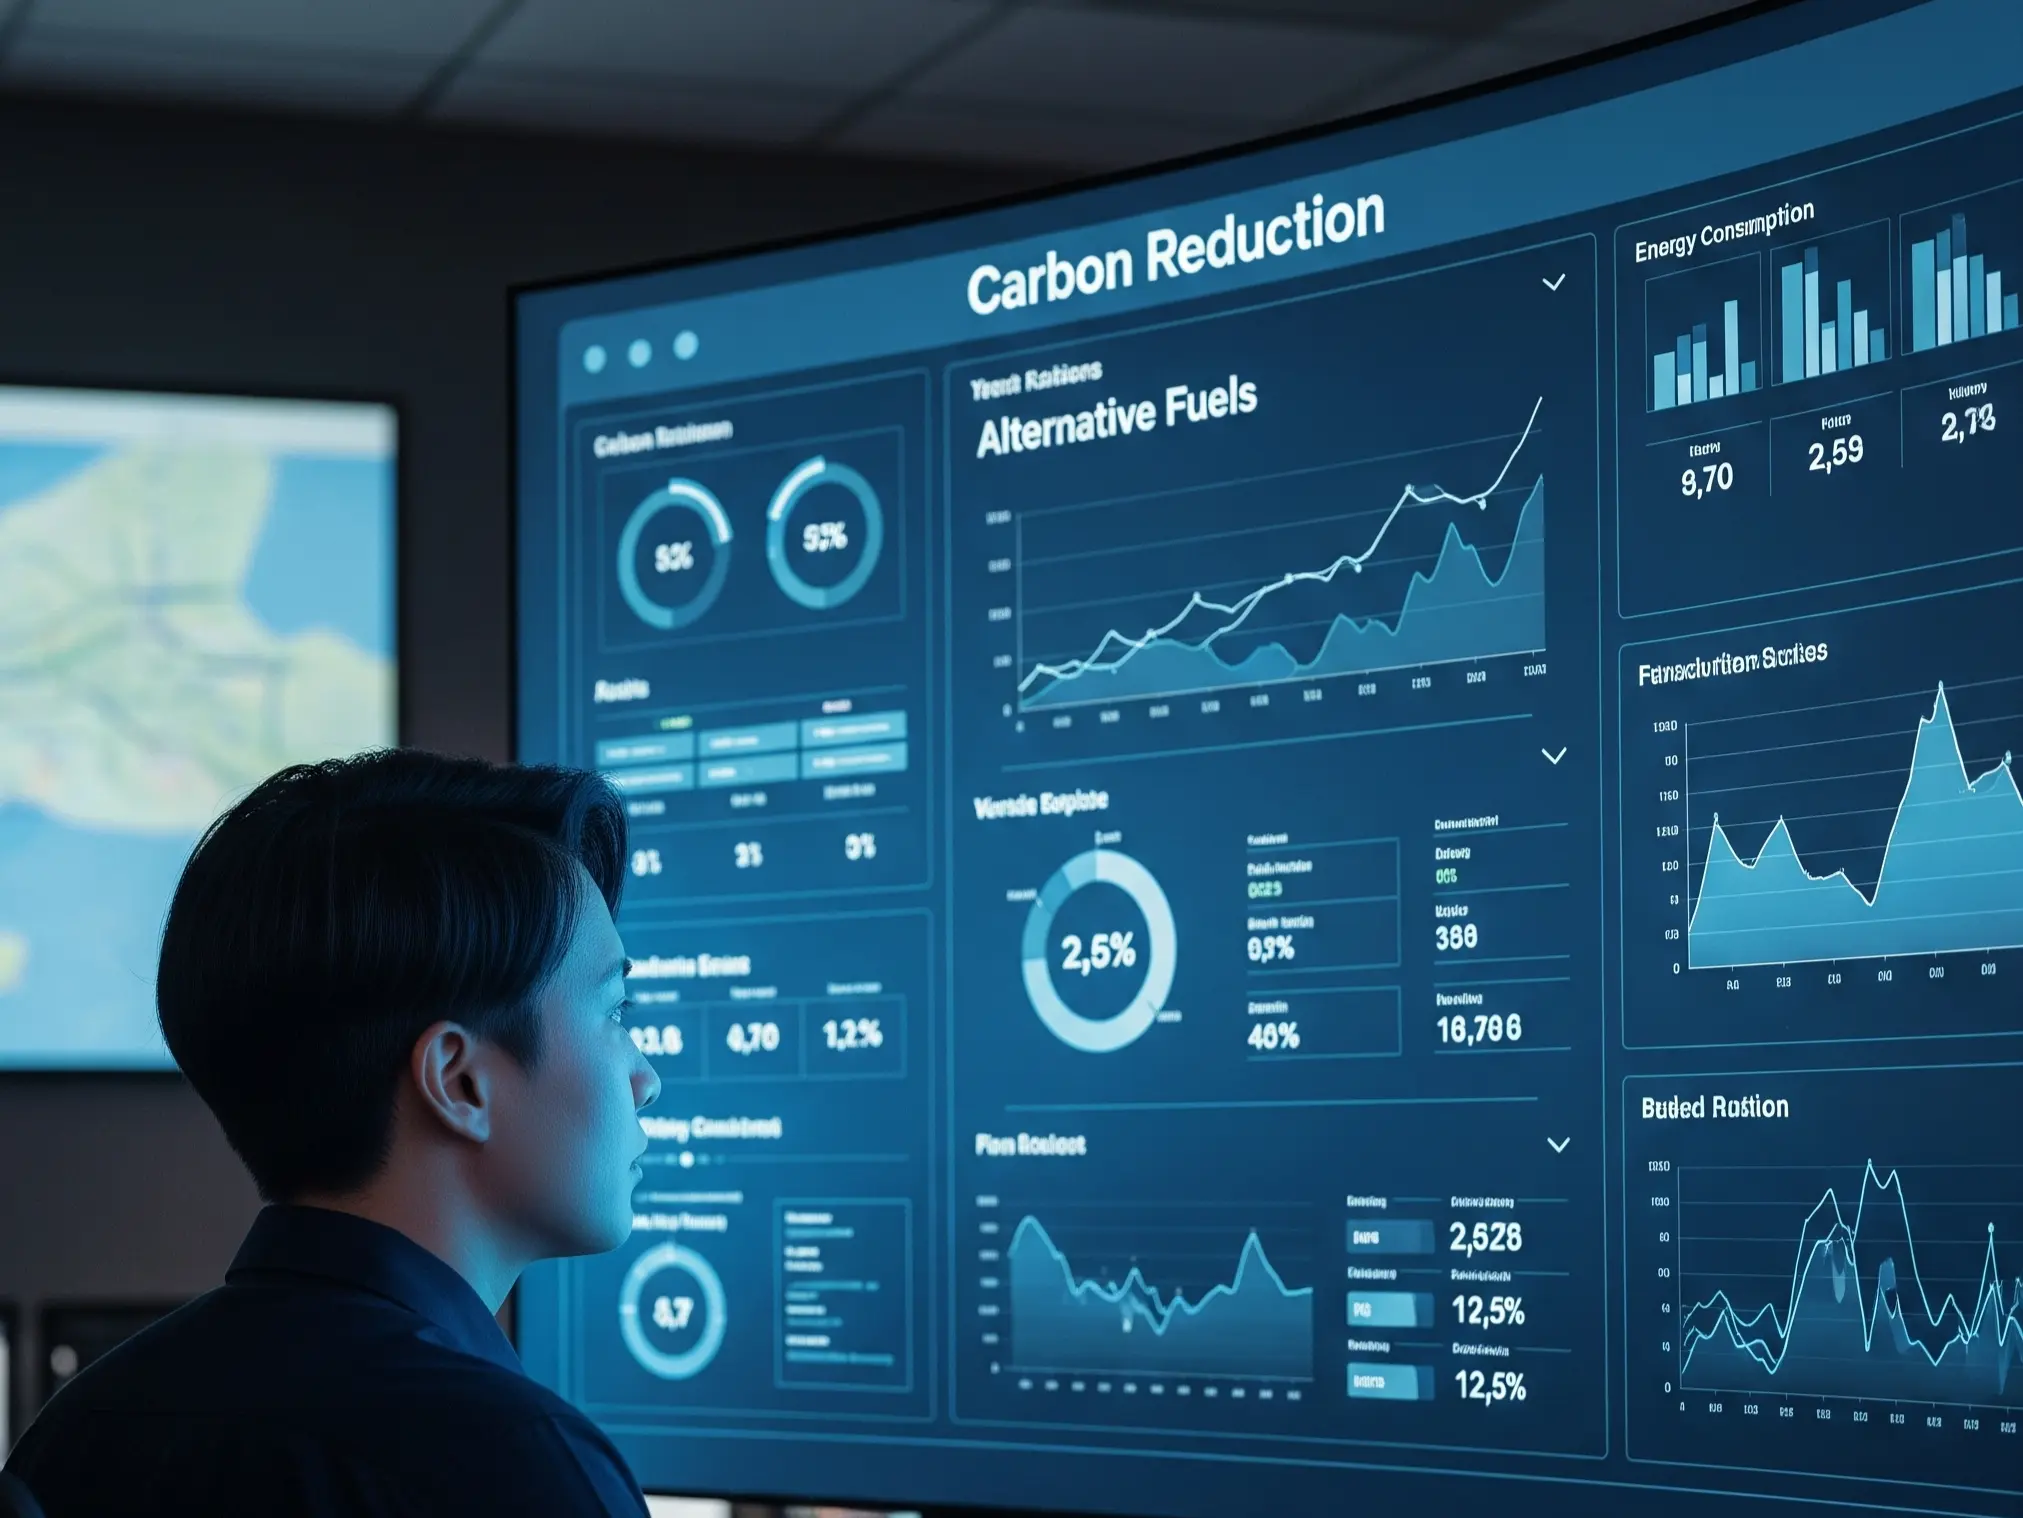
Daily: AI Carbon Reduction Management Platform real-time data, warnings for achievement situation; Monthly: Reports on executives' management meetings; Annually: Tied with performance bonus
In 2021, based on the SBT commitment, the "Alternative Raw (Fuel) Material Indicator Assessment Method" was established, and each plant set carbon reduction assessment indicators according to the actual situation
TCC set an internal carbon price of NT$300/ton-CO2e in Taiwan, based on LSE’s guidelines, and RMB101/ton-CO2e in Mainland China, in anticipation of the cement industry’s inclusion in carbon trading. This pricing aids in assessing the impact on capital investments and operations
Internal Carbon Trading: In 2024, TCC introduced an internal carbon trading platform, inspired by Guangdong Pilot ETS and EU ETS, to help plants control emission intensity and align product sales. Year-end carbon allowance settlements will influence performance appraisals

Performance
Taiwan: Carbon reduction achieved a 100% execution rate in 2023. Carbon emission intensity (tCO2e/metric ton of cementitious materials) achievement rate is 100%
Mainland China: Carbon reduction achieved a 100% execution rate in 2023. Carbon emission intensity (tCO2e/metric ton of cementitious materials) achievement rate is 99.5%
Taiwan & Mainland China (weight average): Carbon emission intensity (tCO2e/metric ton of cementitious materials) achievement rate 99.13%

New Generation Pure Oxygen Combustion Technology

  • TCC has been working with ITRI since 2011 to develop first- and second-generation calcium-looping carbon capture research and test, which is verified and with a solid basis of practical experience
  • In 2024, TCC and Germany's thyssenkrupp Polysius (tkPOL) cooperate to develop third-generation pure oxygen combustion technology together at Hualien Hoping Plant. Adding oxygen to cement calcination will capture over 90% of CO2, reducing energy needs

Please visit TCC Lastest News for more detail.

Performance
  • Since 2011, a total of NT$189 million has been invested in carbon capture research and development
  • Calcium-looping carbon capture technology: Global R&D 100 Award
    The Oscars of Invention – The Chicago Tribune
  • Negative Carbon Astaxanthin: 2016 National Innovation Award, 2020-2021 National Innovation Excelsior Award

Target
  • Cumulative investment of NT$1.3 billion in 2025
  • 100,000 metric tons captured per year in 2030
  • 1,600,000 metric tons captured per year in 2050


TCC Joins Hands with Germany's thyssenkrupp Polysius to Develop Innovative Carbon Capture Technology with Separate Oxyfuel