Biodiversity
Management Approach
- TCC has established Biodiversity Policy and No-Deforestation Commitment, aiming to achieve No Net Loss (NNL) of nature by 2040. Additionally, TCC is committed to accumulating positive impacts globally through Nature Positive initiatives
- 100% coverage of Biodiversity Management Plans (BMP) in quarries in Taiwan and Mainland China
- 100% coverage of Quarry Restoration Plans (QRP) in quarries in Taiwan, Mainland China, Türkiye and Portugal
- The quarries in Taiwan and Mainland China passed environmental impact assessments
International Initiatives
Business for Nature Sharing
2025 TCC was invited by Business for Nature to present at the 2025 Asia Nature Conference, sharing its strategies and achievement in nature and sustainability.
Invited to Join the SBTN Pilot Group
2024 TCC joined the SBTN Pilot Group promoted by BCSD Taiwan, as the only invited construction materials company in Taiwan.
TNFD Early Adopters
2024 TCC becomes the only Taiwan large-scale construction materials company that join the TNFD Early Adopter.
It's Now for Nature Strategic Partner
2024 Nature & Biodiversity Report-TNFD Pilot Program has been endorsed by Business for Nature, representing the construction materials industry join "It's Now for Nature" campaign.
BfN Initiatives Signing
2022 Signed on "Call to Action" and "Make It Mandatory" of Business for Nature to call on governments to enact ambitious policies to halt nature losses.
TNFD Pilot Program
2022 Taiwan's first traditional manufacturer to join TNFD Pilot Program.
Taiwan Nature Positive Initiative
2022 Partook in the Taiwan Nature Positive Initiative (TNPI) of BSCD-Taiwan and connected with the collaborative networks on nature topics to jointly address biodiversity issues.
Dr. Cecilia Koo Botanic Conservation Center
Since 2007, TCC has provided long-term support to the Dr. Cecilia Koo Botanic Conservation Center, dedicated to the global conservation of tropical and subtropical plants through ex-situ living preservation.
Biodiversity Exposure & Assessment
TCC Biodiversity risk assessment covers the cement business operations in Taiwan and Mainland China, including its own operations, upstream, and downstream activities. This encompassed quarries, cement plants, RMC plants, port areas, shipping stations and the surrounding areas within 2 km radius.
.png)
| TCC Operational Sites | Supplier Operational Sites in Taiwan and Mainland China | |
|---|---|---|
| Overall 1 | 118|6,252.31 ha | 128|398,000.25 ha |
| Assessment | 118|6,252.31 ha | 128|398,000.25 ha |
| Exposure 2 | 10|1,687.70 ha | 21|94,660.39 ha |
| Management Plans 3 | 8|1,686.60 ha | Supplier engagement in progress |
Note
- Based on the methodology of S&P Global Corporate Sustainability Assessment (CSA), company offices are not included in the count.
- The definition of high-impact sites refers to sites with Very High (VH) nature sensitivity.
- TCC Operational sites in Taiwan and Mainland China are managed according to the ISO 14001 environmental management guidelines; quarries have developed biodiversity management plans in accordance with the Environmental Impact Assessment Act (Taiwan) and the Environmental Impact Assessment Law (Mainland China). For more details, please refer to the 2024 Sustainability Report.
Evaluate | TCC and Supplier Operational Types ENCORE Results
2024 – TCC completed LEAP analysis for Taiwan operational sites.
2025 – TCC expended the scope of LEAP analysis to global cement industry and suppliers in Taiwan and Mainland China, and completed the Locate analysis and ENCORE under Evaluate analysis .
2025-2026 – Expected to complete LEAP analysis for global cement industry .
| Quarry | Cement Plant | RMC Plant | Aggregate Plant | Grinding Station | Port Area | Shipping Station | Environmental Protection Company | Power Plant | Paper Bag Plant | ||
|---|---|---|---|---|---|---|---|---|---|---|---|
Dependency | Air filtration services | 1 | 1 | 1 | 1 | 1 | 1 | 1 | 1 | 1 | 1 |
Biological control services |
|
|
|
|
| 1 | 1 | 1 |
| 1 | |
Biomass provisioning services | 2 |
|
|
|
|
|
|
|
|
| |
Flood mitigation services | 4 | 3 | 3 | 3 | 3 | 4 | 1 | 1 | 3 | 3 | |
Global climate regulation services | 4 | 1 | 1 | 1 | 1 | 1 | 1 | 1 | 3 | 1 | |
Local climate regulation services | 2 | 2 | 2 | 2 | 2 | 2 | 2 |
| 2 | 2 | |
Noise attenuation services | 1 | 1 | 1 | 1 | 1 | 1 | 1 | 1 | 1 | 1 | |
Animal-based energy | 2 |
|
|
|
|
|
|
|
|
| |
Dilution by atmosphere and ecosystems | 3 | 2 | 2 | 2 | 2 |
|
| 3 |
| 2 | |
Mediation of sensory impacts | 2 | 1 | 1 | 1 | 1 |
|
| 1 |
|
| |
Rainfall pattern regulation services | 5 | 2 | 2 | 2 | 2 | 1 | 1 | 3 |
| 3 | |
Soil and sediment retention services | 4 | 2 | 2 | 2 | 2 | 2 | 3 | 1 | 3 | 2 | |
Solid waste remediation |
| 3 | 3 | 3 | 3 |
|
| 5 | 3 | 3 | |
Storm mitigation services | 3 | 3 | 3 | 3 | 3 | 3 | 2 | 2 | 2 | 3 | |
Water flow regulation services | 4 | 3 | 3 | 3 | 3 | 3 | 1 | 3 | 4 | 3 | |
Water purification services | 5 | 3 | 3 | 3 | 3 |
|
| 3 | 3 |
| |
Water supply | 4 | 3 | 3 | 3 | 3 | 2 | 1 | 3 | 4 | 3 | |
Natural disaster protection | 5 | 5 | 5 | 5 | 5 | 5 | 5 | 5 | 5 |
| |
Impact | Area of freshwater use | 4 | 3 | 3 | 3 | 3 | 1 |
|
| 3 |
|
Area of land use | 3 | 2 | 2 | 2 | 2 | 2 | 2 | 3 | 3 | 2 | |
Area of seabed use | 4 |
|
|
|
| 3 |
|
|
|
| |
Disturbances | 4 | 3 | 3 | 3 | 3 | 1 | 1 | 4 | 5 | 3 | |
Emissions of GHG | 4 | 4 | 4 | 4 | 4 | 3 | 3 | 4 | 5 | 3 | |
Emissions of non-GHG air pollutants | 4 | 4 | 4 | 4 | 4 | 2 | 2 | 3 | 5 | 4 | |
Emissions of nutrient pollutants to water and soil |
| 3 | 3 | 3 | 3 | 3 | 1 | 4 |
|
| |
Emissions of toxic pollutants to water and soil | 4 | 5 | 5 | 5 | 5 | 2 | 1 | 4 | 5 | 3 | |
Generation and release of solid waste | 2 | 3 | 3 | 3 | 3 | 2 | 2 | 3 | 4 | 4 | |
Introduction of invasive species | 1 |
|
|
|
|
| 1 | 3 |
|
| |
Other abiotic resource extraction | 5 |
|
|
|
|
|
|
|
|
| |
Volume of water use | 3 | 3 | 3 | 3 | 3 | 2 | 2 | 3 | 3 | 3 | |
| 0810 Quarrying of Stone, Sand and Clay | 0510 Mining of Hard Coal | 0899 Other Mining and Quarrying Not Elsewhere Classified | ||
|---|---|---|---|---|
| Dependency | Air filtration services | 1 | 1 | 1 |
Biological control services | 2 | 2 | 2 | |
Flood mitigation services | 4 | 4 | 4 | |
Global climate regulation services | 4 | 4 | 4 | |
Local climate regulation services | 2 | 2 | 2 | |
Noise attenuation services | 1 | 1 | 1 | |
Animal-based energy | 2 | |||
Dilution by atmosphere and ecosystems | 3 | 3 | 3 | |
Mediation of sensory impacts | 2 | 2 | 2 | |
Rainfall pattern regulation services | 5 | 5 | 5 | |
Soil and sediment retention services | 4 | 3 | 3 | |
Solid waste remediation | 2 | 2 | ||
Storm mitigation services | 3 | 3 | 3 | |
Water flow regulation services | 4 | 4 | 4 | |
Water purification services | 5 | 5 | 5 | |
Water supply | 4 | 4 | 4 | |
Natural disaster protection | 5 | 5 | 5 | |
Impact | Area of freshwater use | 4 | 4 | 4 |
Area of land use | 3 | 3 | 3 | |
Area of seabed use | 4 | 4 | ||
Disturbances | 4 | 4 | 4 | |
Emissions of GHG | 4 | 5 | 4 | |
Emissions of non-GHG air pollutants | 4 | 4 | 4 | |
Emissions of toxic pollutants to water and soil | 4 | 4 | 4 | |
Generation and release of solid waste | 2 | 3 | 3 | |
Introduction of invasive species | 1 | 1 | ||
Other abiotic resource extraction | 5 | 3 | ||
Volume of water use | 3 | 3 | 3 | |
Biodiversity Index
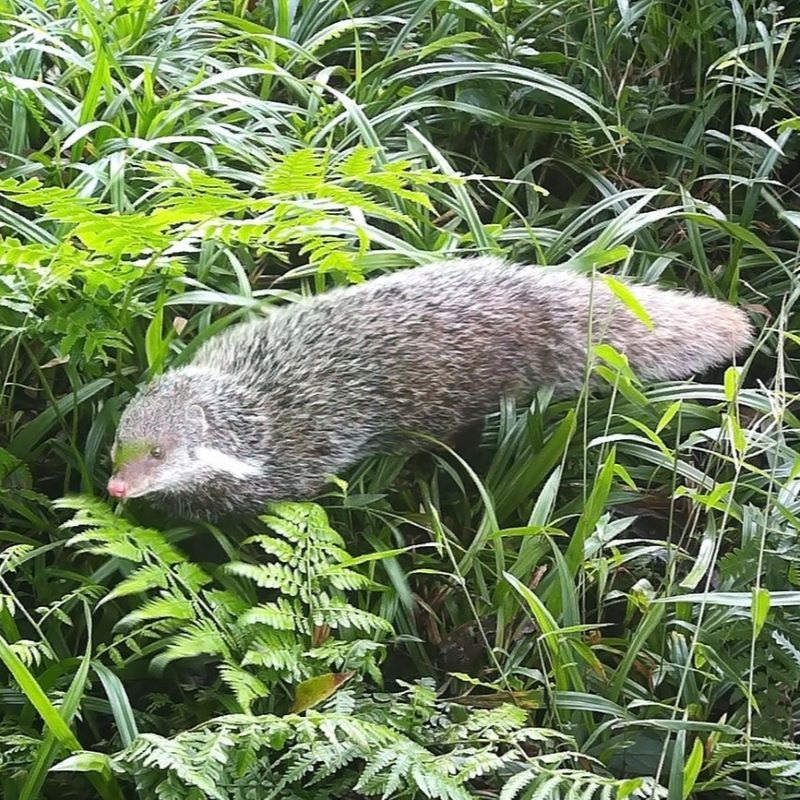
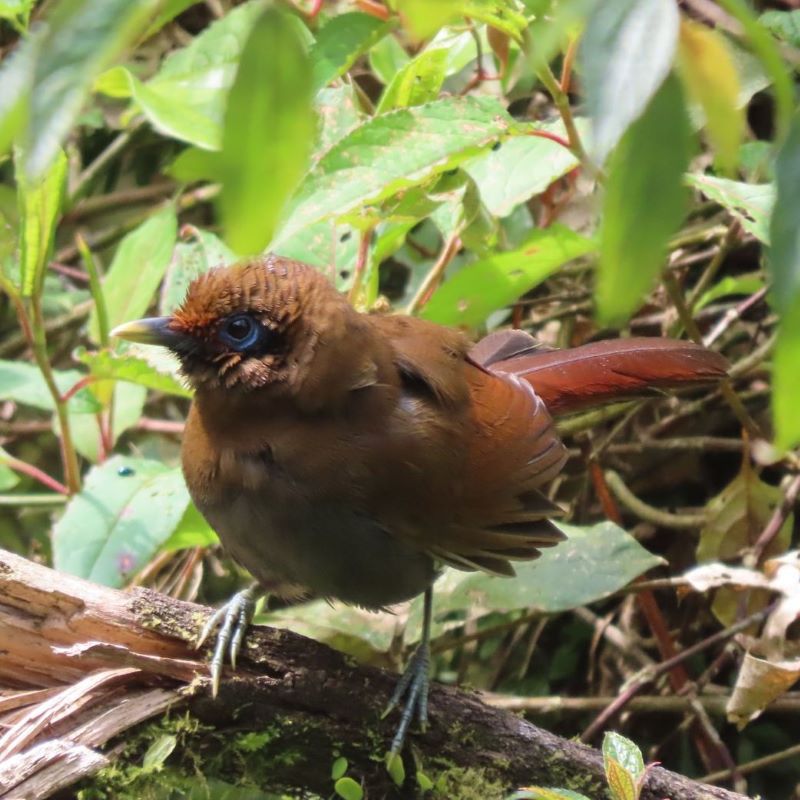
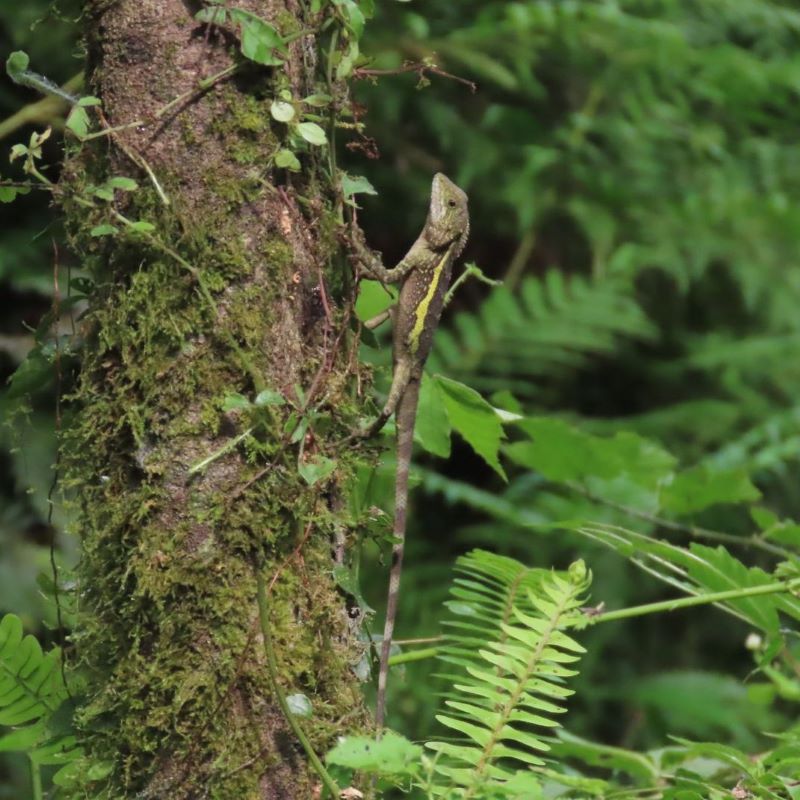
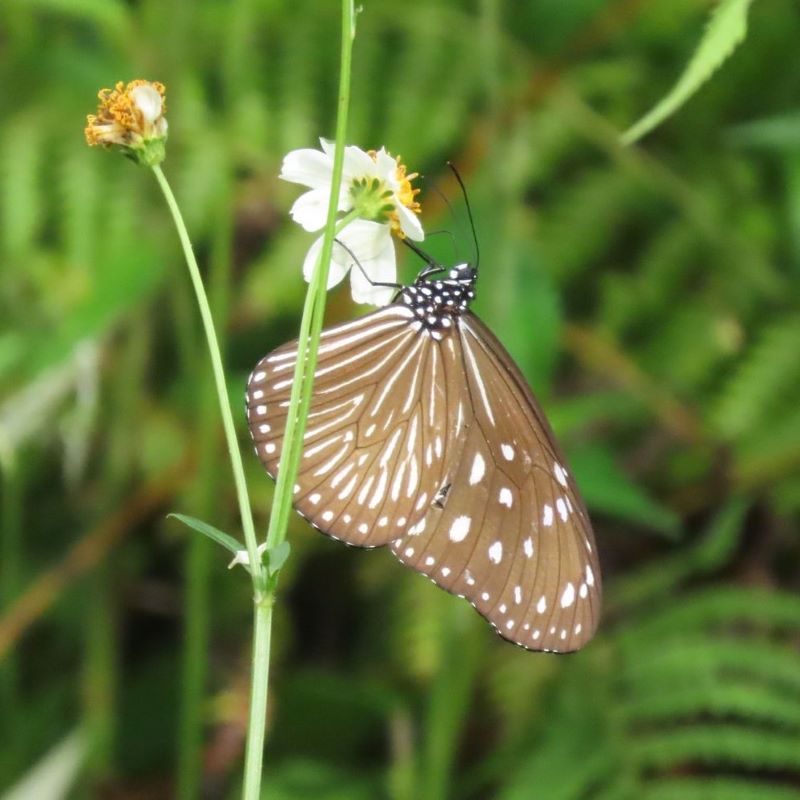
Biodiversity Index in Hoping and Taibaishan Quarry
Data Source: Annual Third-Party Flora and Fauna Monitoring Report
Shannon-Wiener Index
 |  |  |  |  |  |


